sargraph
This is a simple python tool that uses "sysstat" ("sar") to save information on CPU, RAM and disk usage. The process runs in background and can be controlled with a set of sargraph sub-commands.

Languages
sargraph
Copyright (c) 2019-2026 Antmicro
This is a simple python tool that uses "sysstat" ("sar") to save information on CPU, RAM and disk usage. The process runs in background and can be controlled with a set of sargraph sub-commands.
The tool can use "gnuplot" to optionally plot the data it collected. Supported plot formats are PNG, SVG and ASCII, they are determined by filename extensions.
Install requirements
The sargraph requires gnuplot, sysstat (sar), python3 and coreutils to operate.
In Debian you can install them with:
# install system dependencies
apt-get update
apt-get install -qqy --no-install-recommends \
    coreutils \
    git \
    gnuplot-nox \
    python3 \
    python3-pip \
    sysstat

# install Python dependencies
pip3 install -r requirements.txt
For rendering HTML plots, you additionally have to install:
pip3 install git+https://github.com/antmicro/servis#egg=servis[bokeh]
Example graph
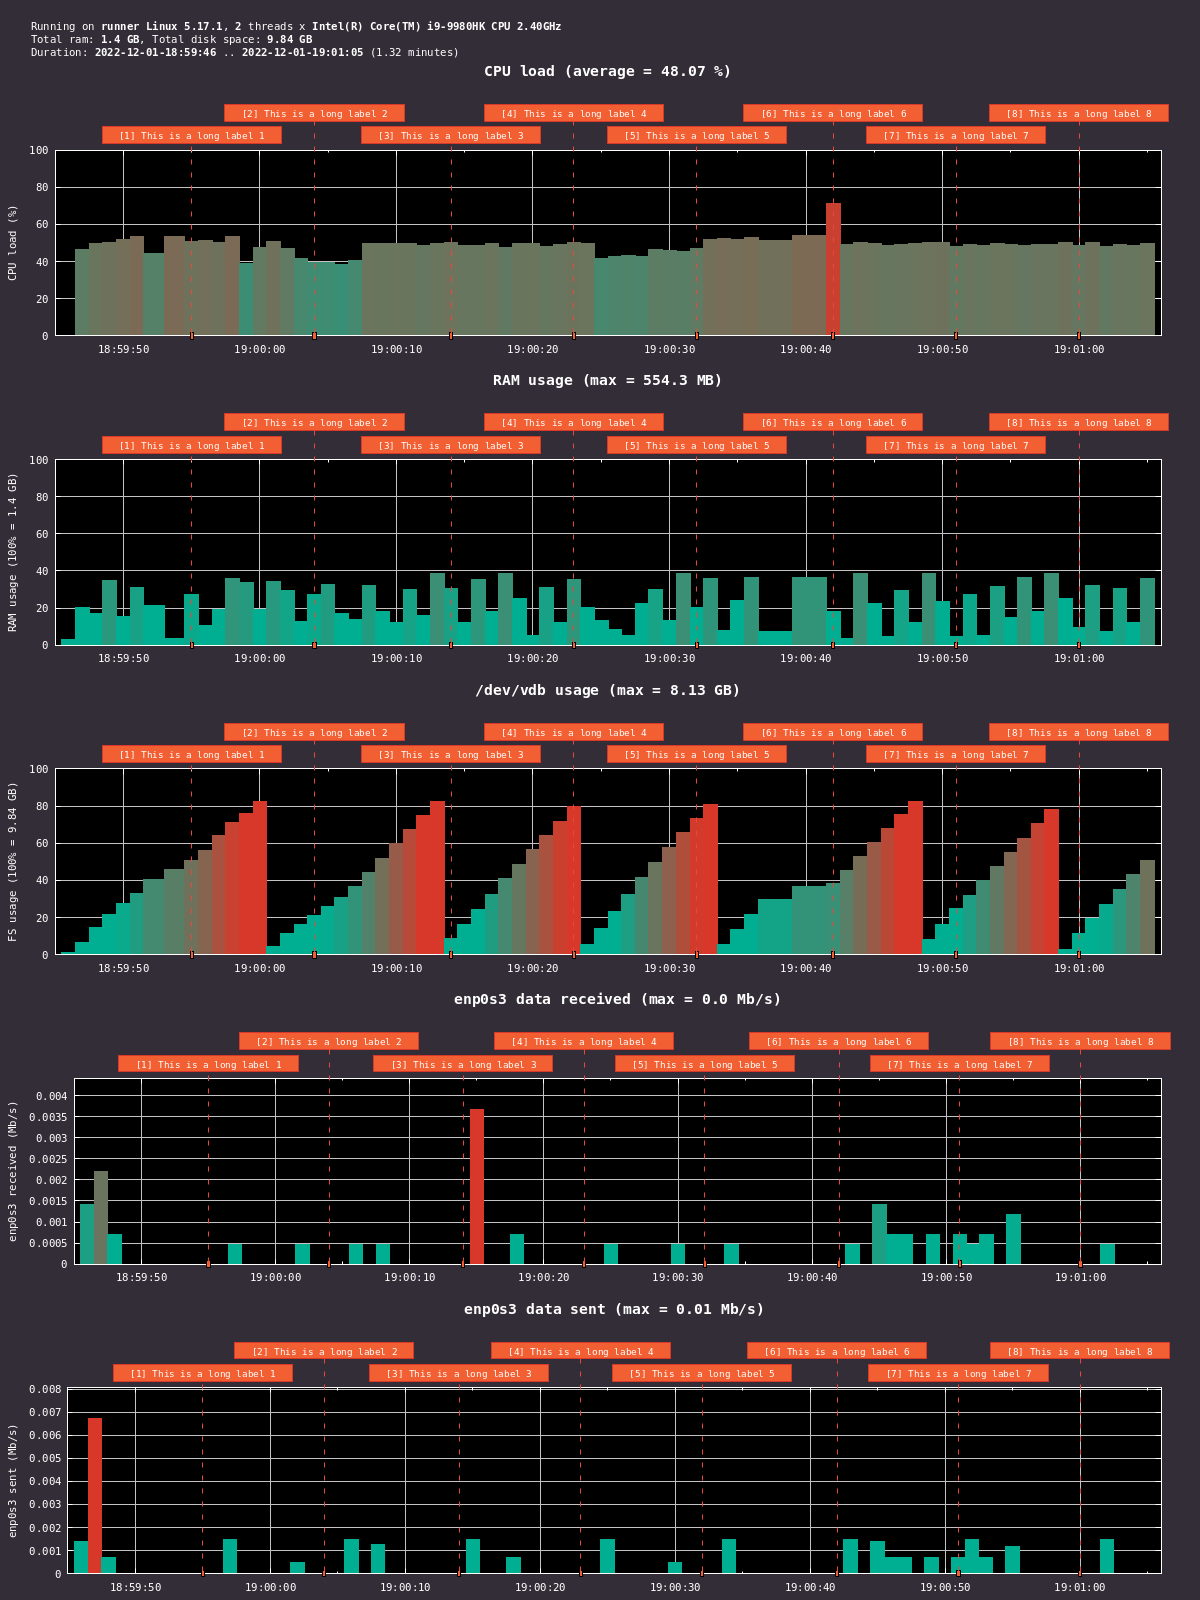
Usage
All sargraph commands use the following pattern:
$ ./sargraph.py [session_name] [command] [args...]
Let's create a sample disk on which we will run stress tests:
dd if=/dev/zero of=sample_disk.ext4 bs=1M count=130
mkfs.ext4 sample_disk.ext4
mkdir -p ./mountpoint && mount sample_disk.ext4 ./mountpoint
For the purpose of stress tests let's install stress:
apt-get install stress
Starting a session
Start a background session and name it example:
./sargraph.py example start -m ./mountpoint
The data will be saved in example.txt.
Logs from screen will be written to example.log.
-m flag allows to specify a chosen filesystem/mountpoint.
Adding a label
Add labels that will be placed as comments in the collected dataset. They will be also visible on the plots:
./sargraph.py example label "Compilation start"
After this, let's simulate some processing:
pushd ./mountpoint
stress -c 16 -i 1 -m 1 --vm-bytes 512M -d 1 --hdd-bytes 70M -t 160s
popd
Plotting a running session
It is possible to plot data collected so far in a still running session:
# Save plot to SVG
./sargraph.py example save plot.svg
# Save plot to PNG
./sargraph.py example save plot.png
# Save plot to ASCII that can be printed in terminal
./sargraph.py example save plot.ascii
# Save plot to interactive HTML plot
./sargraph.py example save plot.html
The supported formats are:
pngformatsvgformathtmlformatasciiformat - plot is rendered to text file that can be displayed in terminal
Stopping a session
Stop a session and create a final plot.png plot file if no other plot was created so far:
./sargraph.py example stop
The filename of the final plot can be changed if its placed after the stop command.
If the name is none then no plot will be created.
Plotting a closed session
Plot data collected in a session that is not running anymore.
./sargraph.py example plot plot.ascii
The command requires the example.txt log file to be present in the working directory.
Relevant projects
Nothing found
Apologies, but no results were found.